Drift Quotient
An AI platform that detects contradictions between what organisations claim about their culture and what independent evidence actually shows
Problem
An investor doing due diligence on a potential acquisition. A senior hire weighing up an offer. A board member reviewing ESG commitments. All of them face the same problem: the organisation’s public-facing narrative is compelling, but they have no fast way to stress-test it against independent evidence.
Traditional due diligence is slow — five to ten hours of manual research across Glassdoor, Companies House, press coverage, and regulatory filings. It’s subjective, it misses sources, and it treats different pieces of evidence as separate data points rather than looking for the pattern of contradiction across them.
Visit Drift Quotient AI platform.
From framework to product
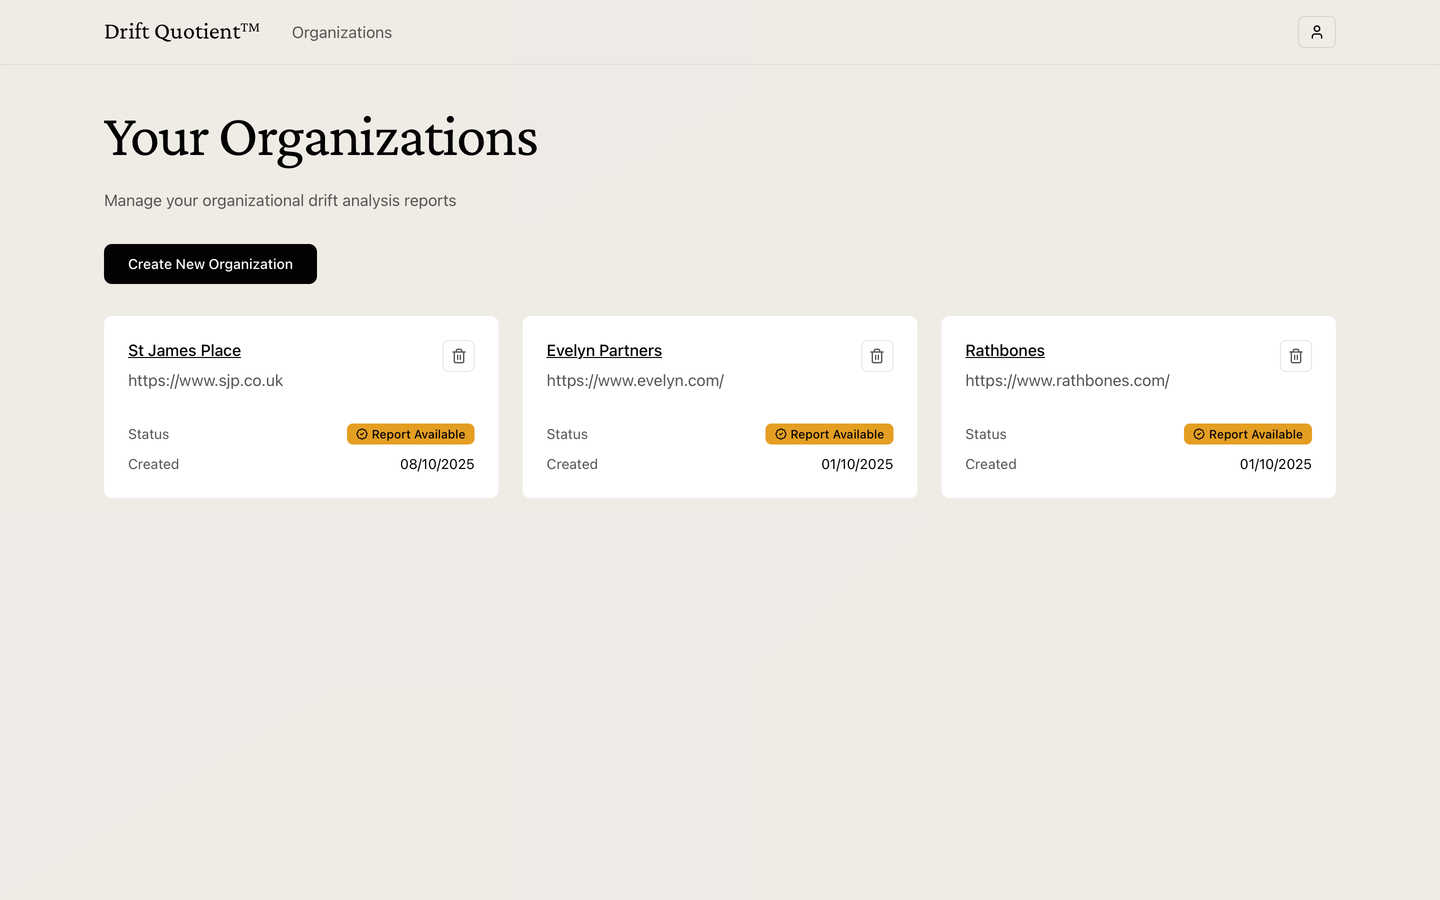
EthosSignal approached me with a proprietary organisational analysis framework — a scoring methodology they own called Drift Quotient™. My task was to transform the initial concept into a well-designed product that senior leadership teams could act on.
The challenge wasn’t just engineering speed. It was balancing the analytical rigour necessary to ensure the LLM generates repeatable and defensible reports — every score needed to be traceable back to cited evidence, not just an AI opinion — alongside core product features like auth, organisation and report management, public and private urls, LLM observability, within a fixed timeframe and budget, whilst designing the initial user experience.
Interaction design
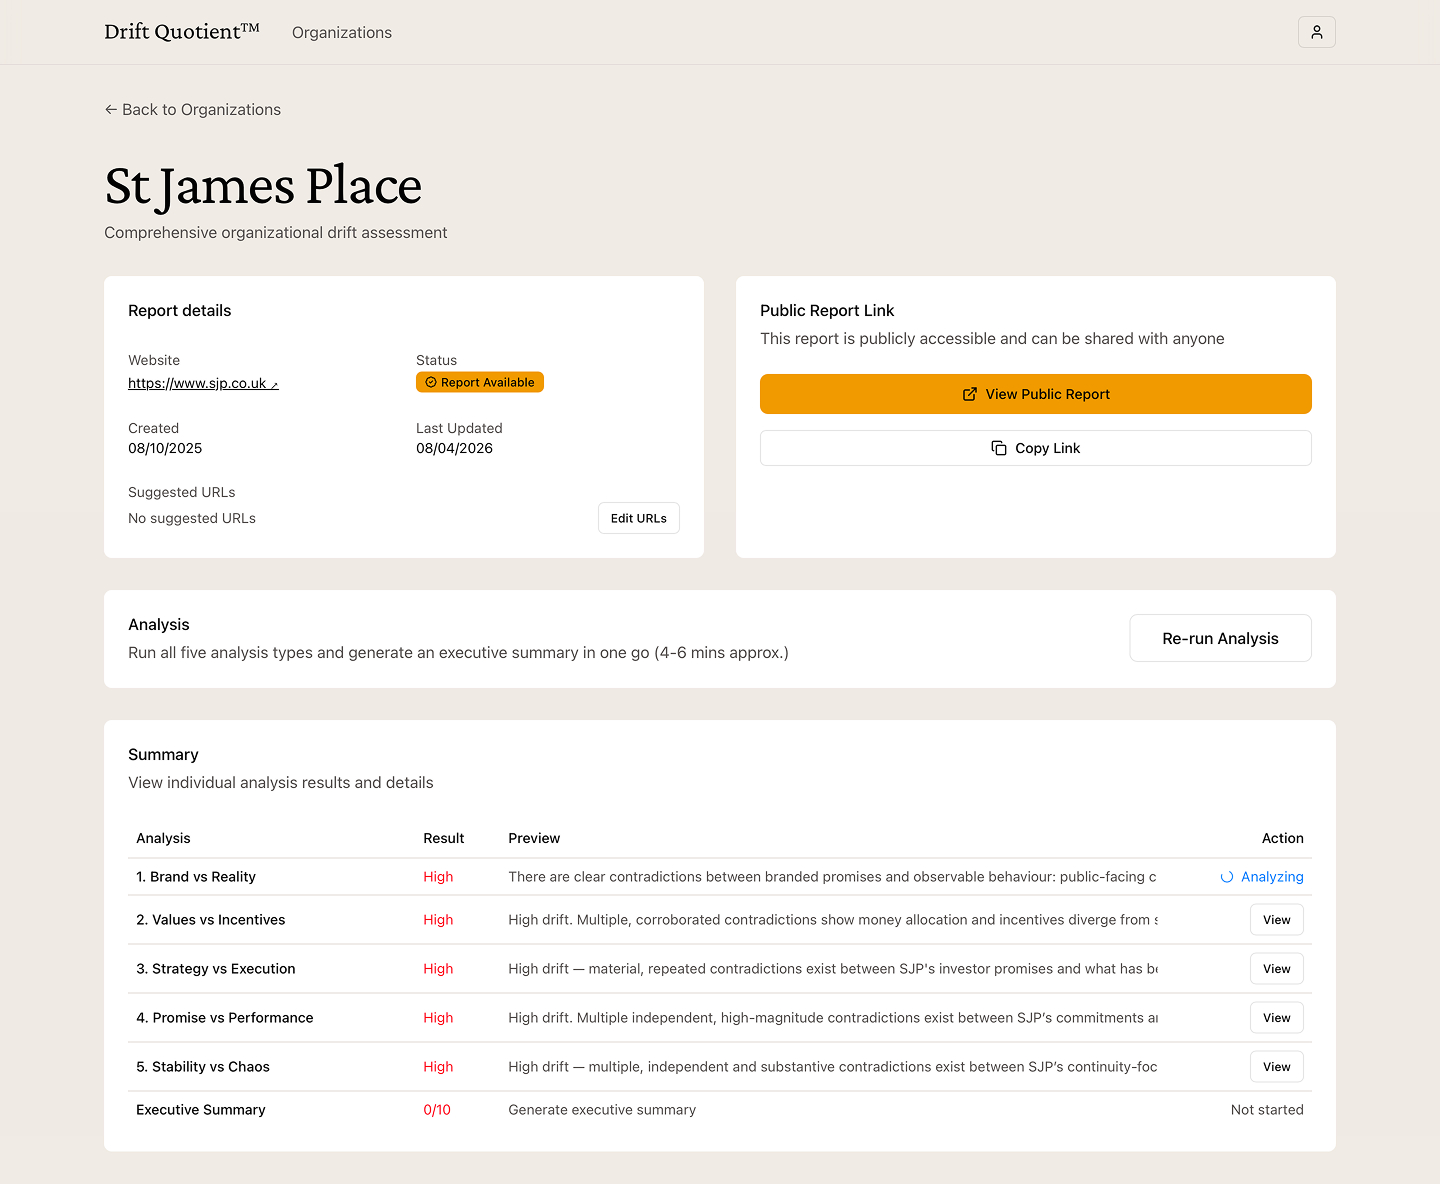
The analysis runs across five organisational dimensions in parallel. I built a real-time status system with elapsed timers per dimension — the user could see each analysis actively running and know exactly where time was going. This was especially important for edge cases where one dimension took longer than others, or the user added additional context and wanted to re-run a single analysis.
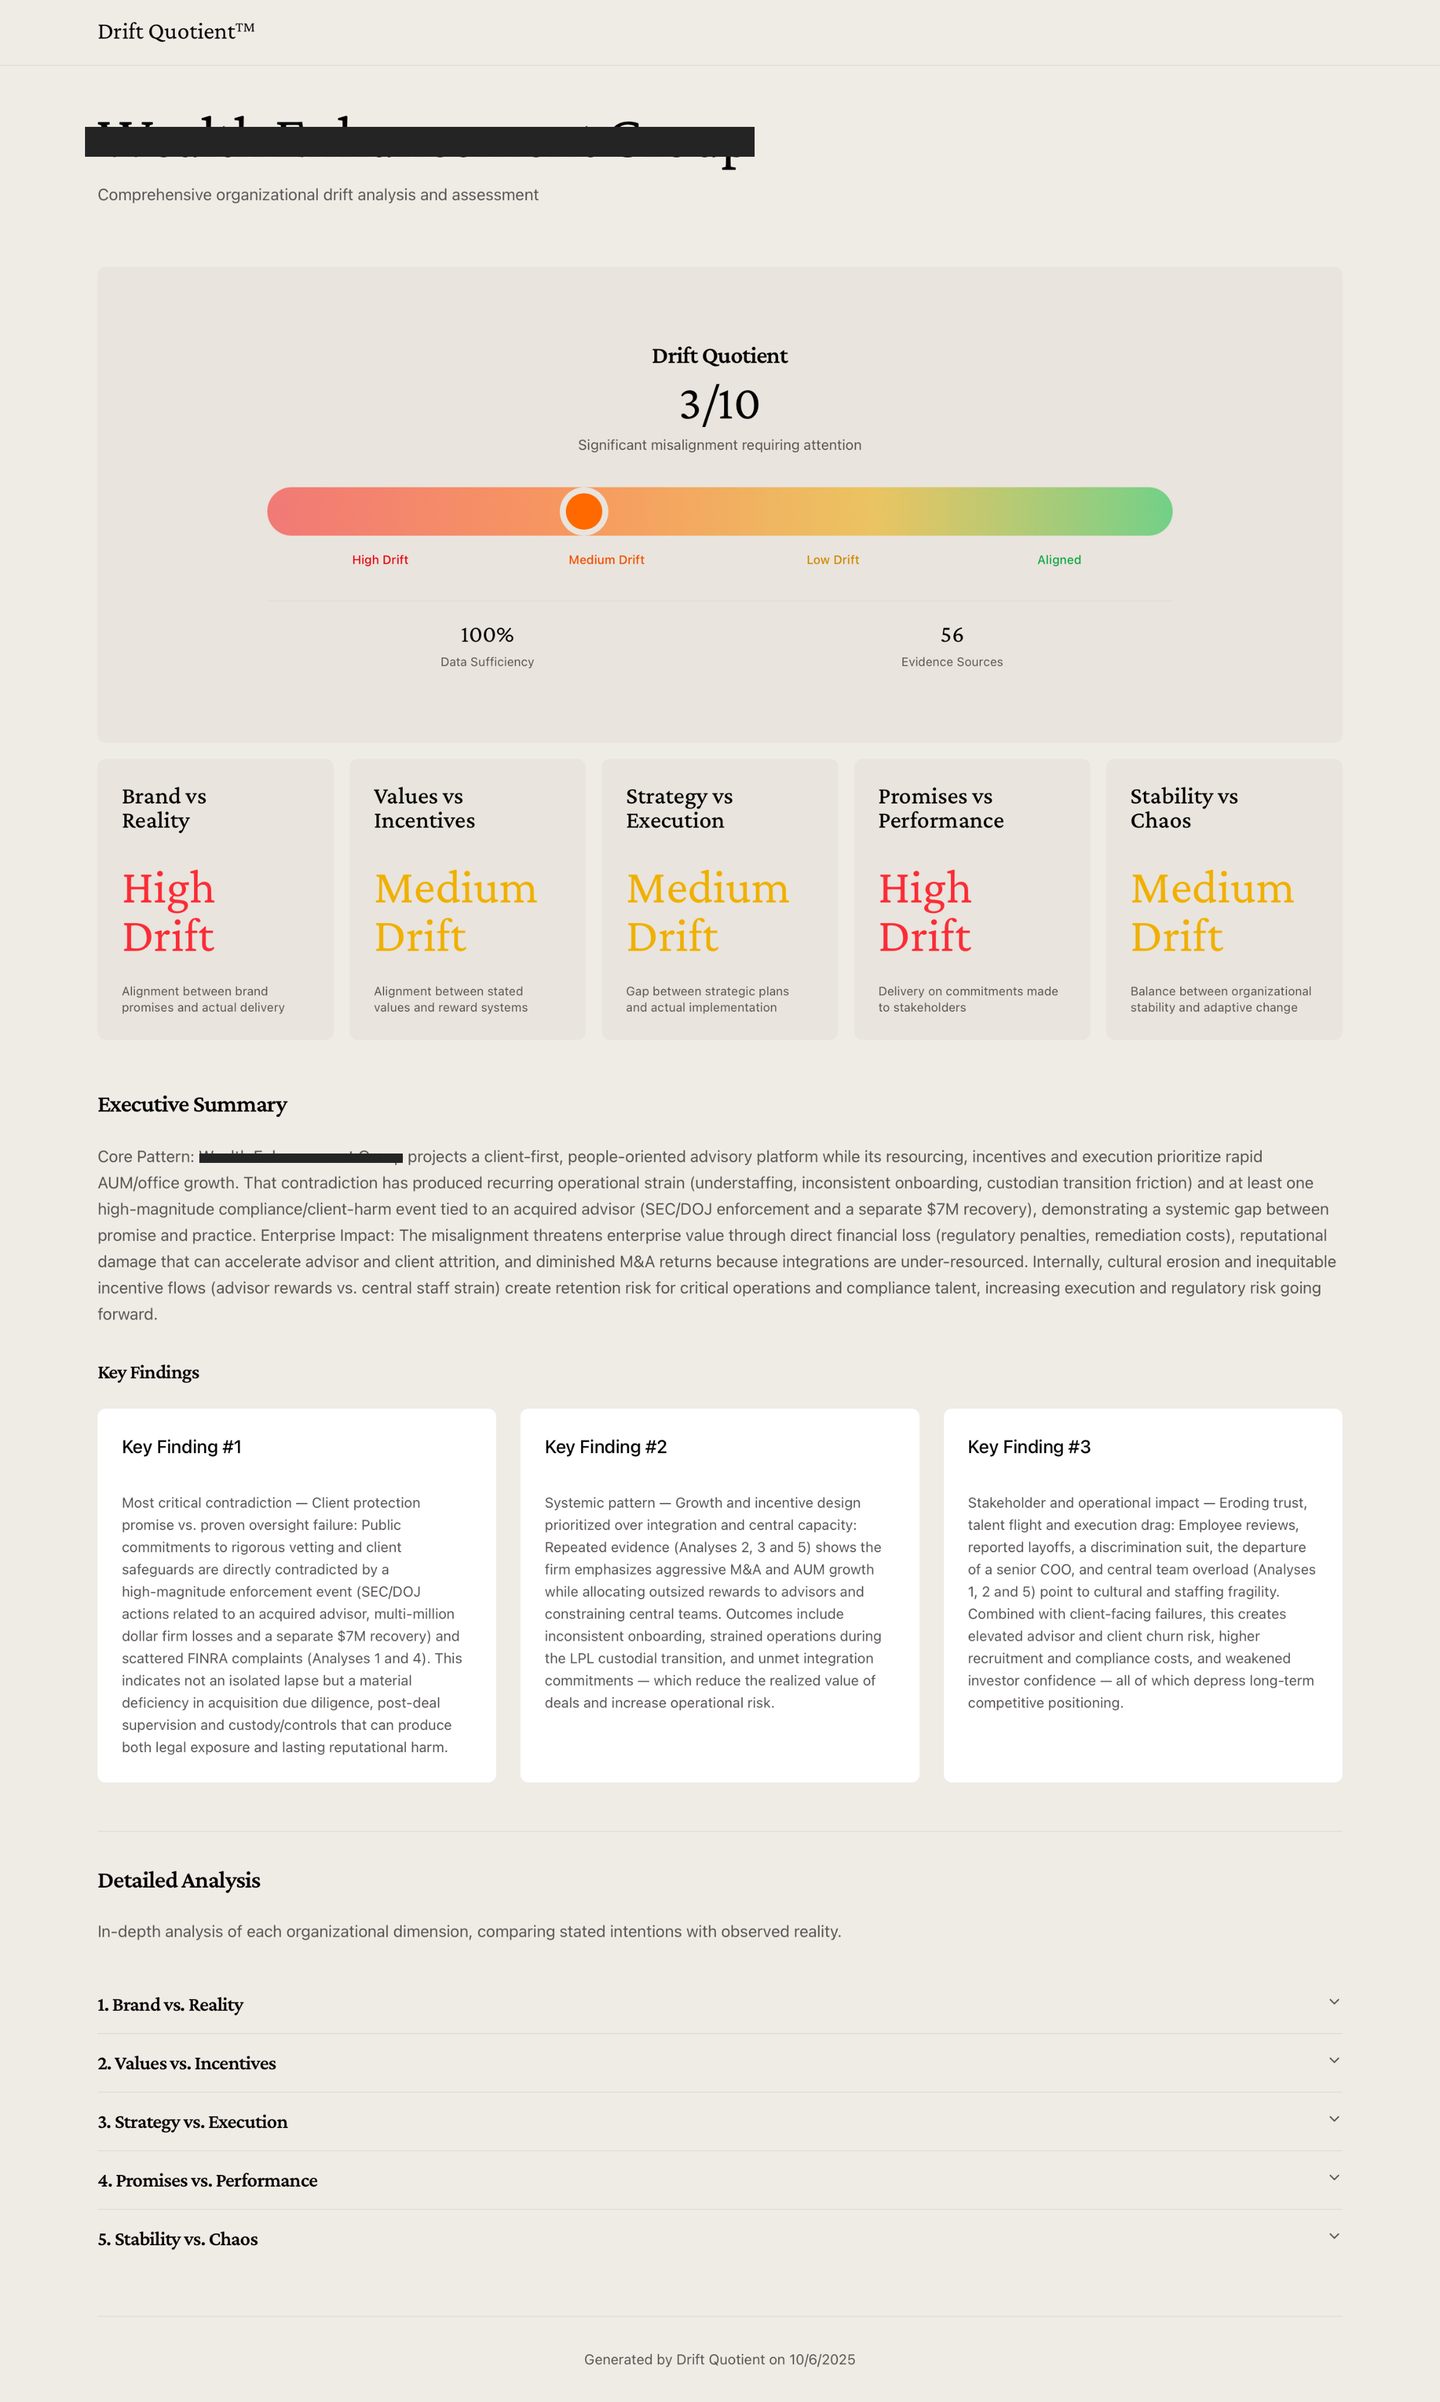
The report itself needed to communicate two things at once: a decisive score and the evidence behind it. To create a gut-instinct reaction I used a colour-coded drift scale — red to green — to give a fast gestalt read, then structured each dimension’s section so the cited evidence sat immediately below the score rather than in a footnote. The goal was to provide immediate insight whilst making reasoning easily accessible when needed.
Technical architecture
The core constraint was cost: a platform charging per analysis needed per-analysis costs to be low enough that the margin held at scale. I chose a combination of GPT-5-mini and GPT-5 because mini can handle multi-source synthesis well at a fraction of the cost and then produce the final report using the more capable model.
- Stack: Next.js (RSC) + Supabase (auth, PostgreSQL, Row Level Security)
- AI: OpenAI GPT-5 + GPT-5-Mini + Vercel AI sdk with web search — strong synthesis at low cost per call
- Validation: Structured outputs with Zod schemas — type-safe parsing prevents hallucinated schema drift
- Observability: PostHog tracking costs, tokens, and latency per API call — essential for pricing model validation
- Parallelism: Five simultaneous analyses reducing total time from 12–15 minutes to 4–6 minutes
Prompt templates were engineered with signal detection frameworks for absolutist language, tone mismatches, and direct contradictions — the specific patterns EthosSignal’s methodology identified as markers of organisational drift. Each template was tuned against real examples from their framework before going into production.
“What stood out most was Luke’s ability to instantly grasp the big-picture vision and translate it into a functional AI system that actually worked, not just a concept, but a living product. He guided us through each stage of development, breaking complex technical challenges into clear, iterative sprints that gave us room to pause, refine, and recalibrate.
What made the process remarkable was how seamlessly he blended technical innovation with creative problem-solving. Each prototype evolved from just a feature build as we’d had it to a design conversation with Luke that helped us clarify who we were building for and why.
Luke’s approach balanced rigor with curiosity. He made the journey from idea to working system feel structured yet exploratory, ensuring that technology served the user experience, not the other way around. We didn’t just walk away with a functional MVP; we walked away with a sharper, validated vision of what we’re creating and how it should feel to the people who use it.”
– Amy Oguntala, CEO EthosSignal
Result
A production-ready platform delivered on schedule, with complete authentication flows, organisation management, a distraction-free analysis dashboard, and shareable public report pages. Each complete analysis costs approximately $0.05–0.15 — an order of magnitude lower than competitors — thanks to model selection, prompt optimisation, and parallel execution working together.
50–100x faster than manual research (6 minutes vs. 5–10 hours). 3–5x broader evidence coverage (30–50+ sources vs. 10–15 manual finds). A standardised scoring methodology that’s repeatable, auditable, and defensible to clients who need to show their working.